.png%3Fwidth=280%26height=38%26name=15617603-6998-4666-ac07-399545edb4b3%20(1).png)
The Chart Section
It's not possible to directly import tables.
The "Charts" section, accessible by clicking on the top center tab "Charts," offers two distinct features:
-
Comparison This feature allows you to graphically compare the prices of different room types.
-
Detail This feature allows you to graphically visualize all the applied price customizations for a room type.
The view is monthly, similar to the calendar section, and the navigation mode between different months is the same.

How to interpret "Details" feature
The "Detail" feature displays the price customizations set for a specific room type.
In detail:
-
"Published" Price > BLUE Line The most important line represents the final price published on the reference list.
-
"Suggested" Price > DASHED BLUE Line The price suggested by Smartpricing's algorithm, which matches the "Published" price where there are no price customizations constraining it.
-
"Maximum" Price > DARK YELLOW Line or Dot Shows the maximum price settings.
-
"Minimum" Price > LIGHT YELLOW Line or Dot Shows the minimum price settings.
-
"Fixed" Price > PURPLE Line or Dot Shows the blocked price settings.
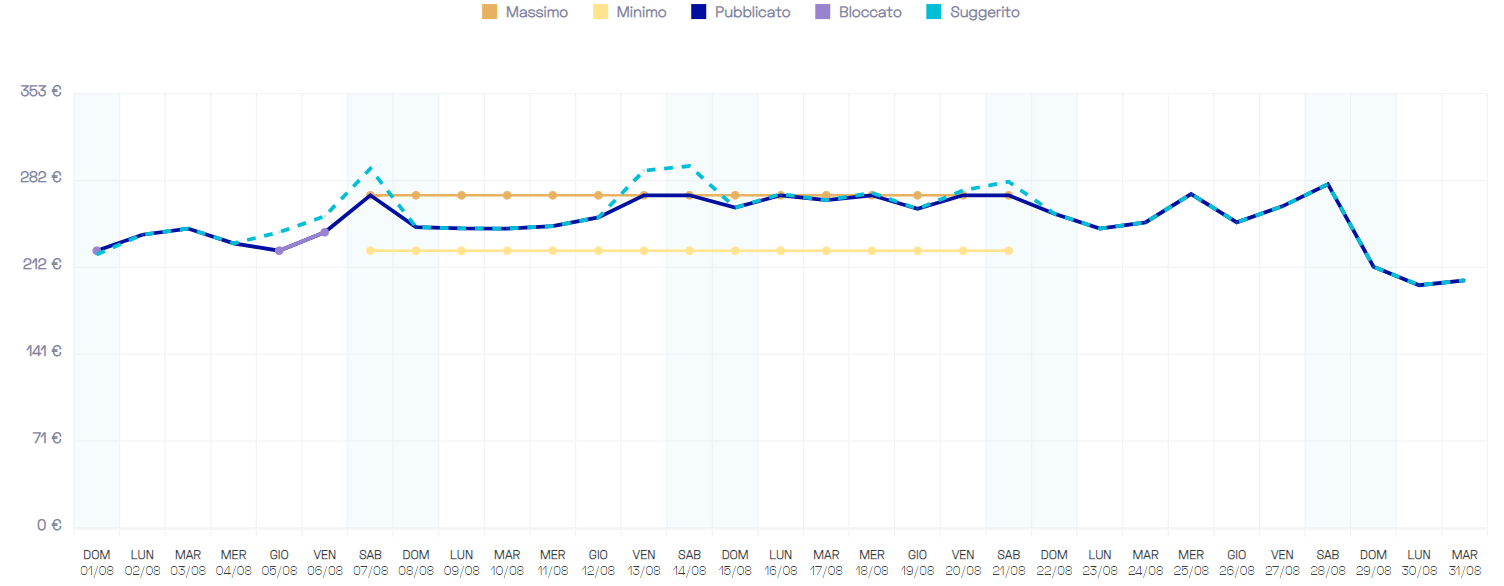
As can be observed from the graph, the behavior of the suggested price is strongly influenced by the price customizations. For example:
- On the date 07/08, a maximum price was set, which constrains Smartpricing's suggested price. In this case, the algorithm suggests a higher price compared to the published price, which adheres to the maximum price setting and aligns with it.
- On the dates 05/08 and 07/08, a fixed price was set. Here again, we see that Smartpricing suggests a higher price, but the published price respects the price setting and aligns with it.
Still need assistance?