Within the "Dashboard," you'll find the information necessary to monitor the performance of your accommodation. Whether it's revenue, occupancy, average daily rate (ADR), or profit for each available room (RevPar), you can access all the information within this screen.
How is the Smartpricing Dashboard structured?
You can access the "Dashboard" from the menu on your left.

Once clicked, you'll visualize the dashboard.
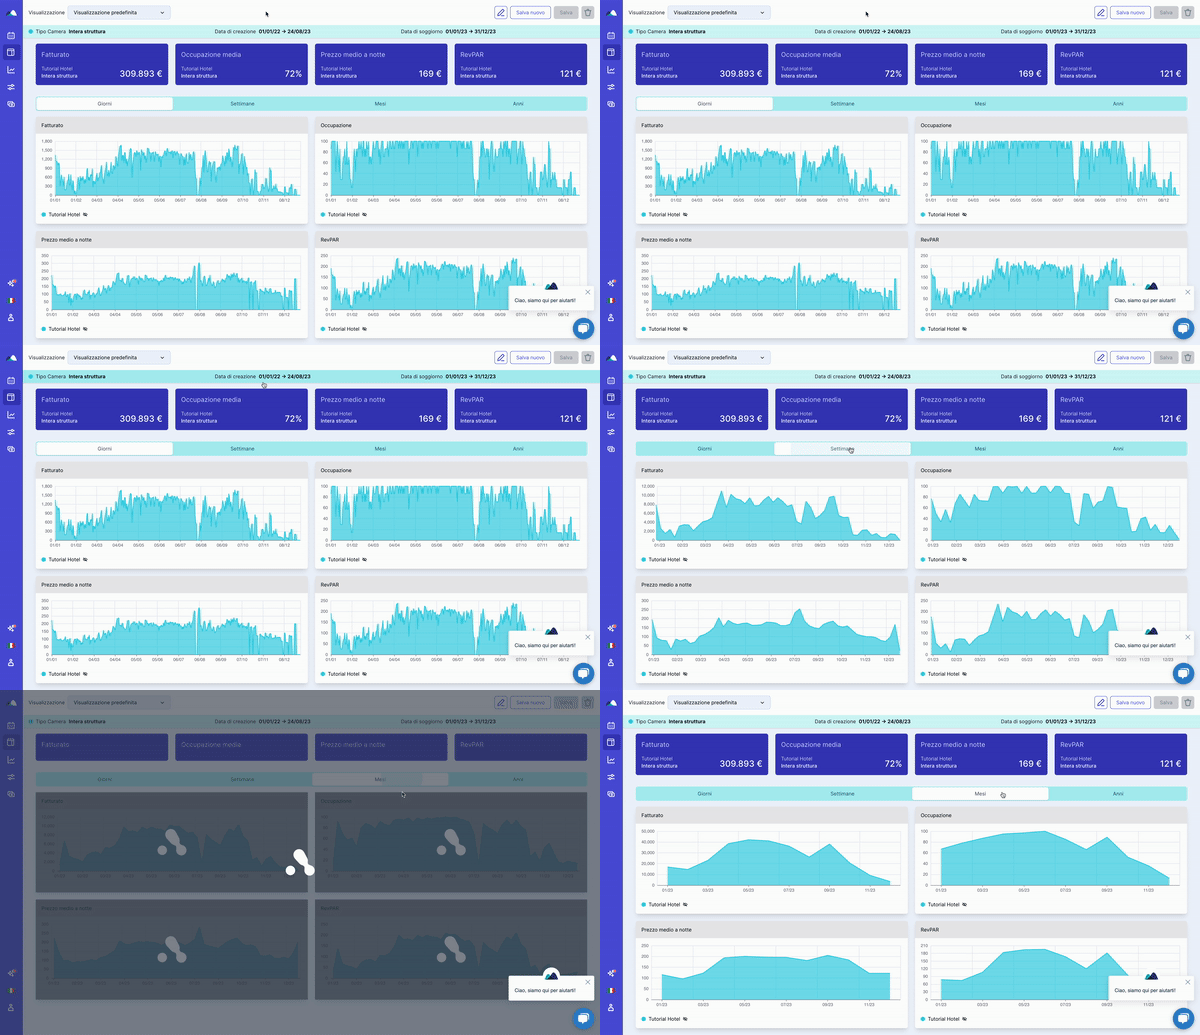
Here, you'll immediately find the key indicators at the top, including revenue, occupancy, average price per night (ADR), and profit per available room (RevPar). Below are detailed graphs.
On the right side, you'll find filters that allow you to conduct more in-depth analyses.
Let's delve into the functionalities in more detail.
General Overview of the Dashboard
Filters section
There are 3 types of filters:
-
Structure Type Filters (A): Available if you manage multiple lodging facilities under a single account.
-
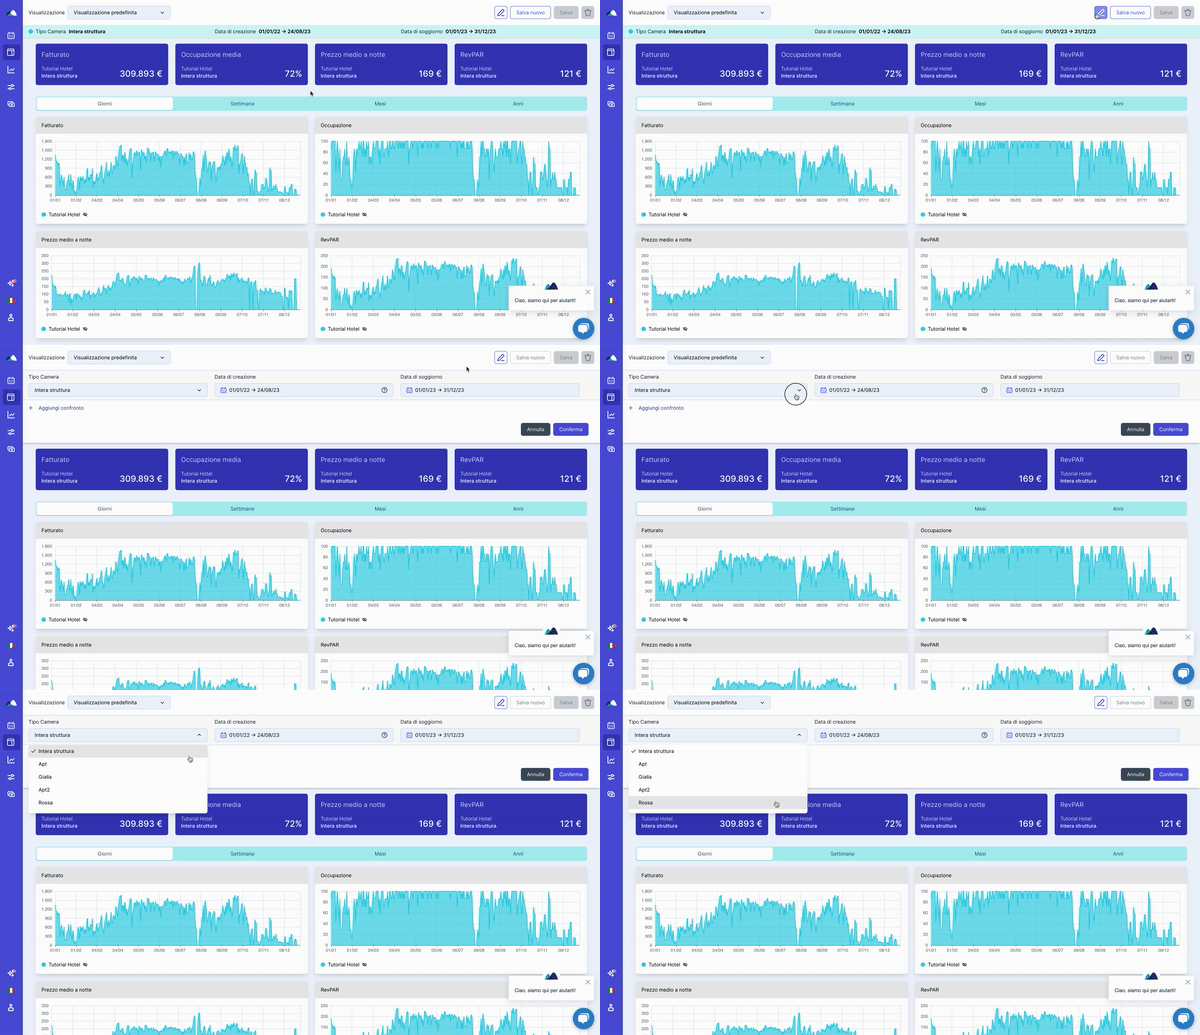
Room Type Filters (B): Filters based on room types.
-
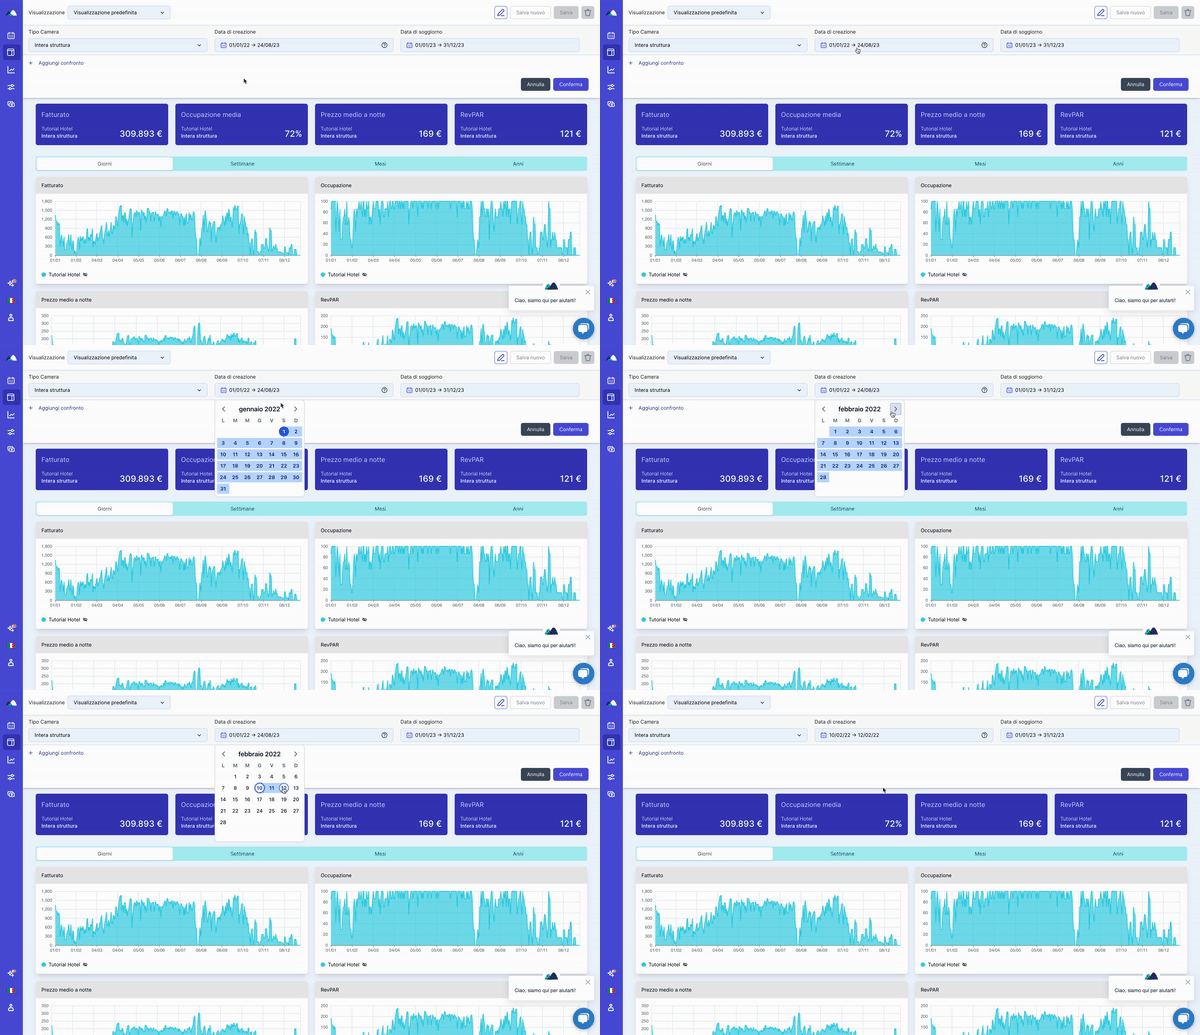
Reservation Creation Date Filters (C): Filters based on the reservation creation date.
-
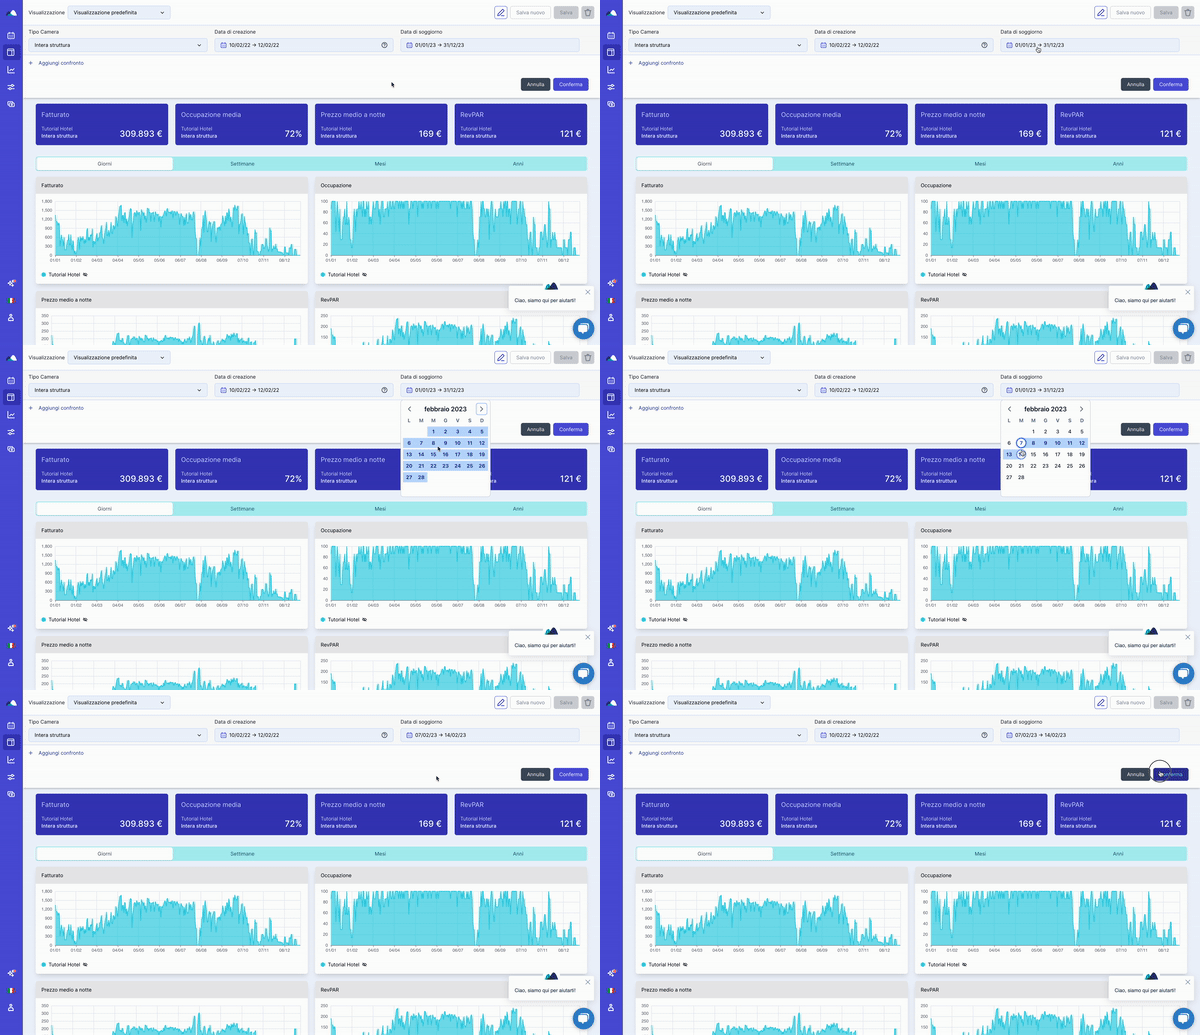
Stay Date Filters (D): Filters based on the stay date.
Once you've set the filters, simply click the "CONFIRM" button.
Room Type Filters (B)
Reservation Creation Date Filters (C)
Stay Date Filters (D)
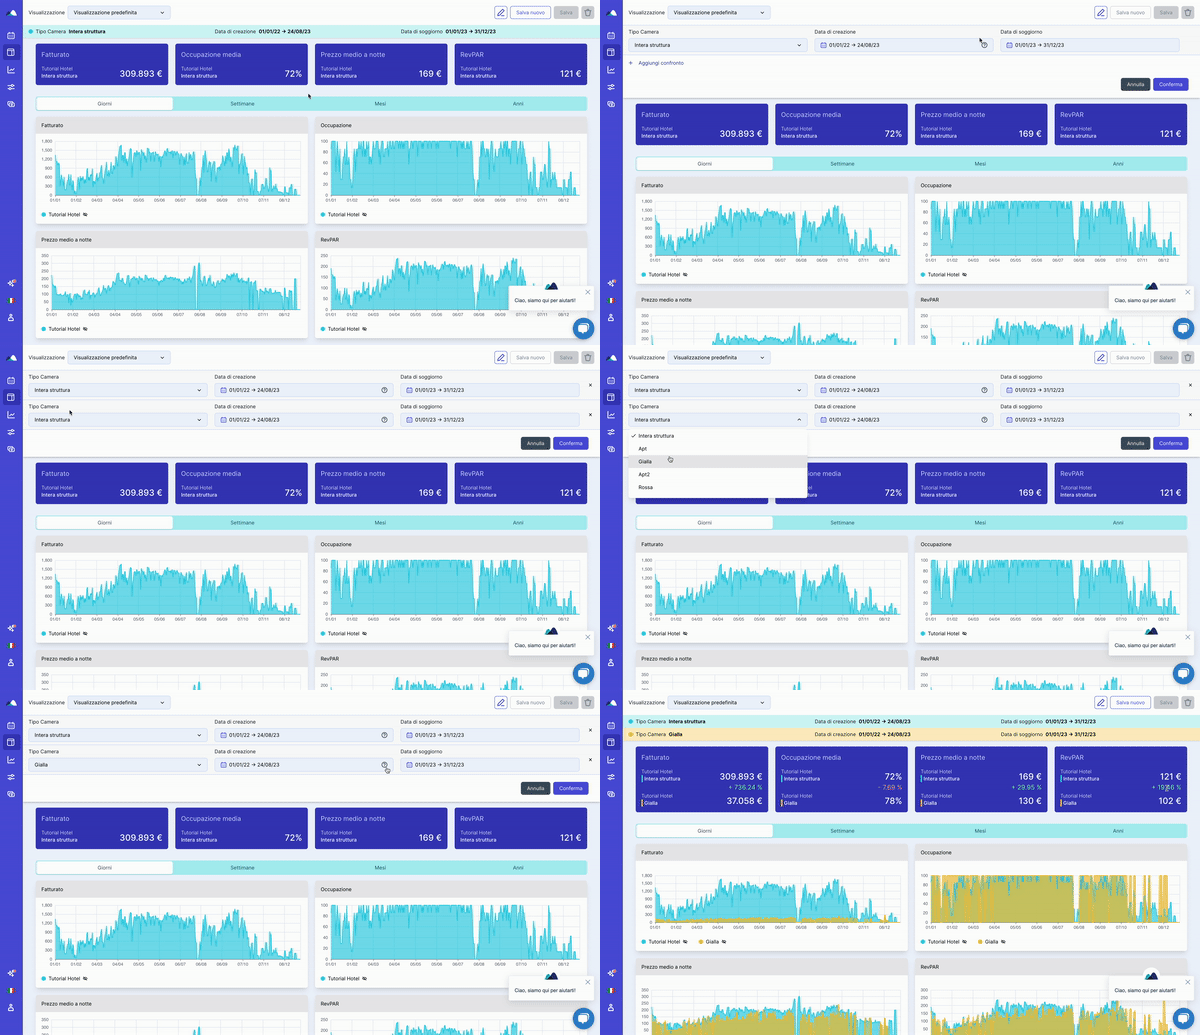
Confront feature
Thanks to this feature, you can compare the data that interests you by room type and for specific periods.
Data visualization on graphs
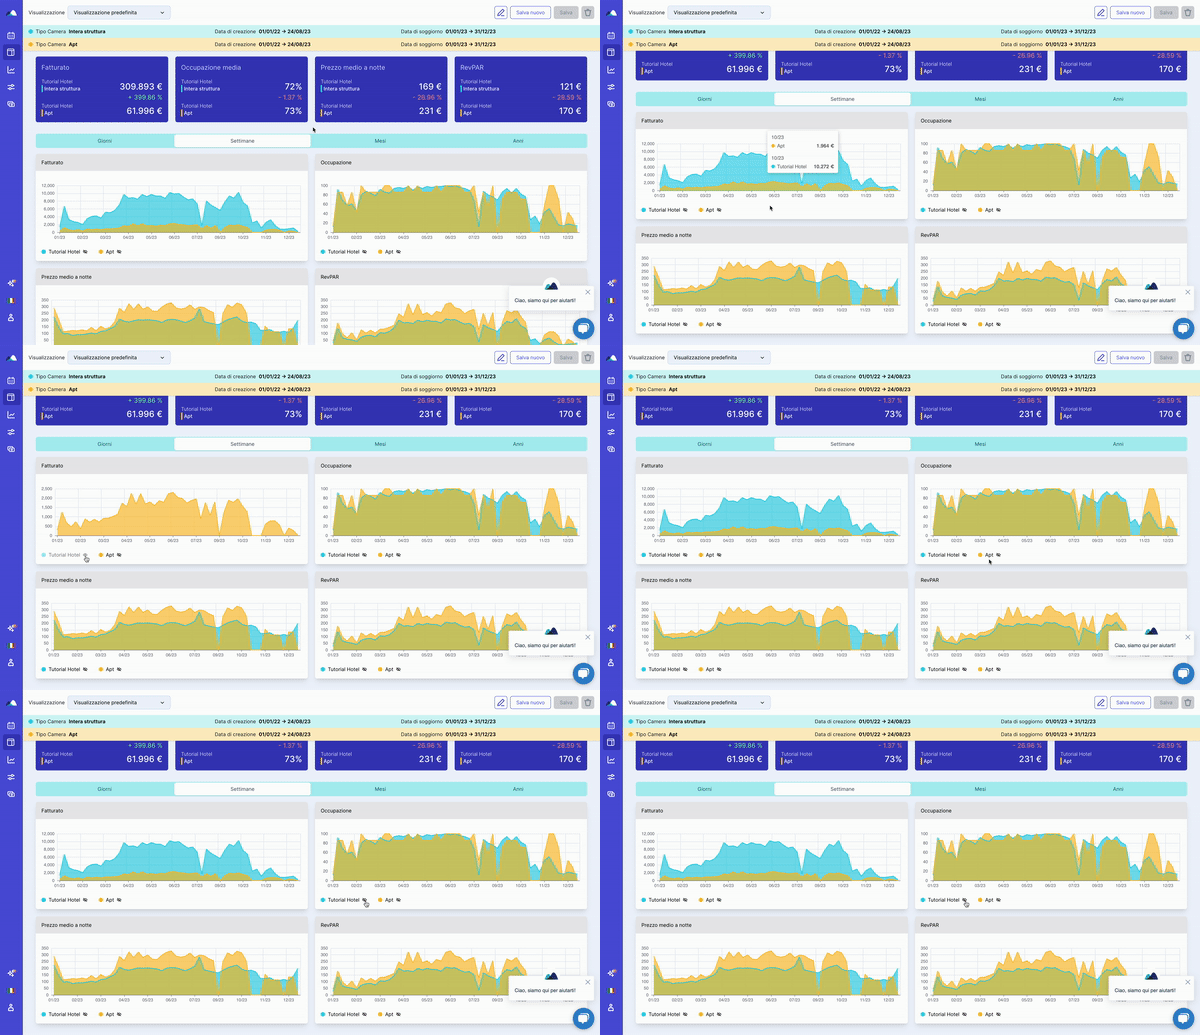
Regarding the data visualization on the graphs, you can select:
- Days
- Weeks
- Months
- Years

You can choose to display only certain data by clicking on the legend items located below the graph.
Still need assistance?
.png%3Fwidth=280%26height=38%26name=15617603-6998-4666-ac07-399545edb4b3%20(1).png)